
Bitcoin: Back to Basics
Bitcoin: Back to Basics
Portfolio Review as of Jan 23, 2022

This week, my portfolio is down 118%.
That means for every dollar put in, I’ve lost a further 18% beyond the original dollar.
In other words, I’ve lost more than I have.
On days like this, it is easy to hit the panic button, so it is probably a good time to get back to basics and explain why I continue to be invested in the asset class.
Before we go on, let’s quickly survey the damage name by name for posterity’s sake:
Ethereum (43% of portfolio): cost basis of $4,021 / current price $2,535 (down 37%)
Cardano (15%): cost $2.01 /current $1.12 ( -44%)
Solana (15%): cost $187 / current $99.6 ( -47%)
Polkadot (14%): cost $44 / current $18.8 (-57%)
Polygon (4%): cost $1.89 / current $1.62 (-14%)
Bitcoin (4%): cost $46,719 / current $36,277 (-22%)
Others (5%)
Factor in the 2.85x leverage, that magnifies losses by another 185%, resulting in an aggregate unrealized loss of around 118%.
Acknowledging my mistakes
I think it is hard to carry on this week’s newsletter without acknowledging the elephant in the room.
Yes - it was a mistake to go all-in back in November of 2021.
People always say hindsight is 20/20. But in this case, my timing literally could not have been worse.
While my cost basis of $4,000 for Ethereum and $46,000 for Bitcoin is nowhere near the November all-time highs of $4,800 and $69,000 respectively, the fall since those records were made have been spectacular.
I had rushed in towards the end of the year as I believed the market cycle will end by December, similar to the previous cycle which lasted four years, and that there was one last puff of the cigarette and it was important to deploy my capital before the run up in prices fizzles out.
Clearly, I was wrong.
Mistake number 2, and probably most crippling was the leverage.
It was contingent on the strategy playing out in a month or two, and being able to pay down my leverage with the gains I would have made.
While the average weighted cost of my financing was fairly low at around 7% and clearly manageable if things did not go my way, the flip side, however, is that if the timing of the strategy didn’t work out precisely the way I thought it would, it severely constrains my options.
For example, if there was a market selloff like this month, I would not be able to take advantage of the lower prices to leverage up at a lower rate, and I’m now stuck with the higher cost basis.
The lesson learnt here is that while it is okay to be deterministic about the medium to long-term trajectory of a trade, it may not be wise to be deterministic over market timing - at least not by compounding the problem with leverage which constrains my options if the slightest thing in the plan goes wrong.
Lesson to my future self: give ample breathing room for things to go wrong.
Bitcoin is volatile, and that’s okay
For those of us who are new to the asset class, we’ve always heard that crypto or bitcoin can be volatile, and we always think we’ll be able to stomach the volatility when it comes.
But volatility comes in two flavors. It can be volatile upwards which gives us the exponential gains that we’ve all heard about, but it can also be volatile downwards.
Judging by crypto twitter, it certainly feels like there are a lot of people who are vomiting at the feet of the volatility gods this week.
Given this month’s stomach churning ride, I think it makes sense to provide some brief perspective of the volatility of Bitcoin in this past market cycle.

As we see in the chart above, since Bitcoin bottomed in the last cycle in December 2018 at around $3,000, it has since gone to as high as $69,000 in November of 2021, which is a 23x return.
But as I’ve circled on the chart, even in this bull market run of 2,200%, Bitcoin has at least declined more than 40% - three times before this month’s decline.
From June of 2019 to November of the same year, Bitcoin went from a high of $11,500 to $6,800 - an approximately 40% decrease just six months after going on a 280% rally from the market bottom of $3,000.
The same happened in the first quarter of 2020, where Bitcoin declined 47% in a matter of three weeks as the coronavirus pandemic first took hold of the financial markets causing panic across all asset classes.
And the last one on number 3 happened in the summer of last year when it declined another 47% - this time from $64,000 to $30,000, for honestly no apparent reason.
Some say its because of a China ban on crypto - but they’ve done it for the 500th time in the last 10 years already so why is this one so special
Others say it’s because of Elon Musk’s tweets - also a little unbelievable.
We’re now on our fourth decline since the market cycle bottomed in 2018, and my guess is, this too shall be over.
Big picture
Taking a step back, I think it is also important to realize that if you had just joined crypto like me in 2021, particularly in the latter half of the year, it is easy to be blinded by recency bias.
For as much pain this recent episode has wrought, it also important to realize how far bitcoin and the crypto asset class has come.
Here’s the best chart to illustrate that.

The above is a chart of Bitcoin’s weekly price action since inception in 2012 on a logarithmic scale.
We use log charts for data that have exponential trends because otherwise the small numbers of the early days when Bitcoin moves from $1 to $2 which is a 100% increase will be overshadowed by a move of $10,000 to $11,000 which is only a 10% move but will show up as a larger increase on a normal chart ($1,000 increase versus $1 increase).
As you can see - the current episode that is getting everybody twisted in knots is on the top right hand corner, and barely even register on the chart.
If you feel that your portfolio is taking a hit, hopefully the above at least gives you some perspective.
As we mentioned about in prior newsletters, exponential trends can be hard for us to appreciate (link here), and if the prior year’s pace of adoption is any indication, chances are, the recent drawdown this past month will in the long run be just another blip on the log chart.
When will Bitcoin bottom?
First of all, nobody knows.
Second of all - you’re speaking to the guy with the world’s worst track record in market timing.
With those disclaimers out of the way - let me give this a crack.
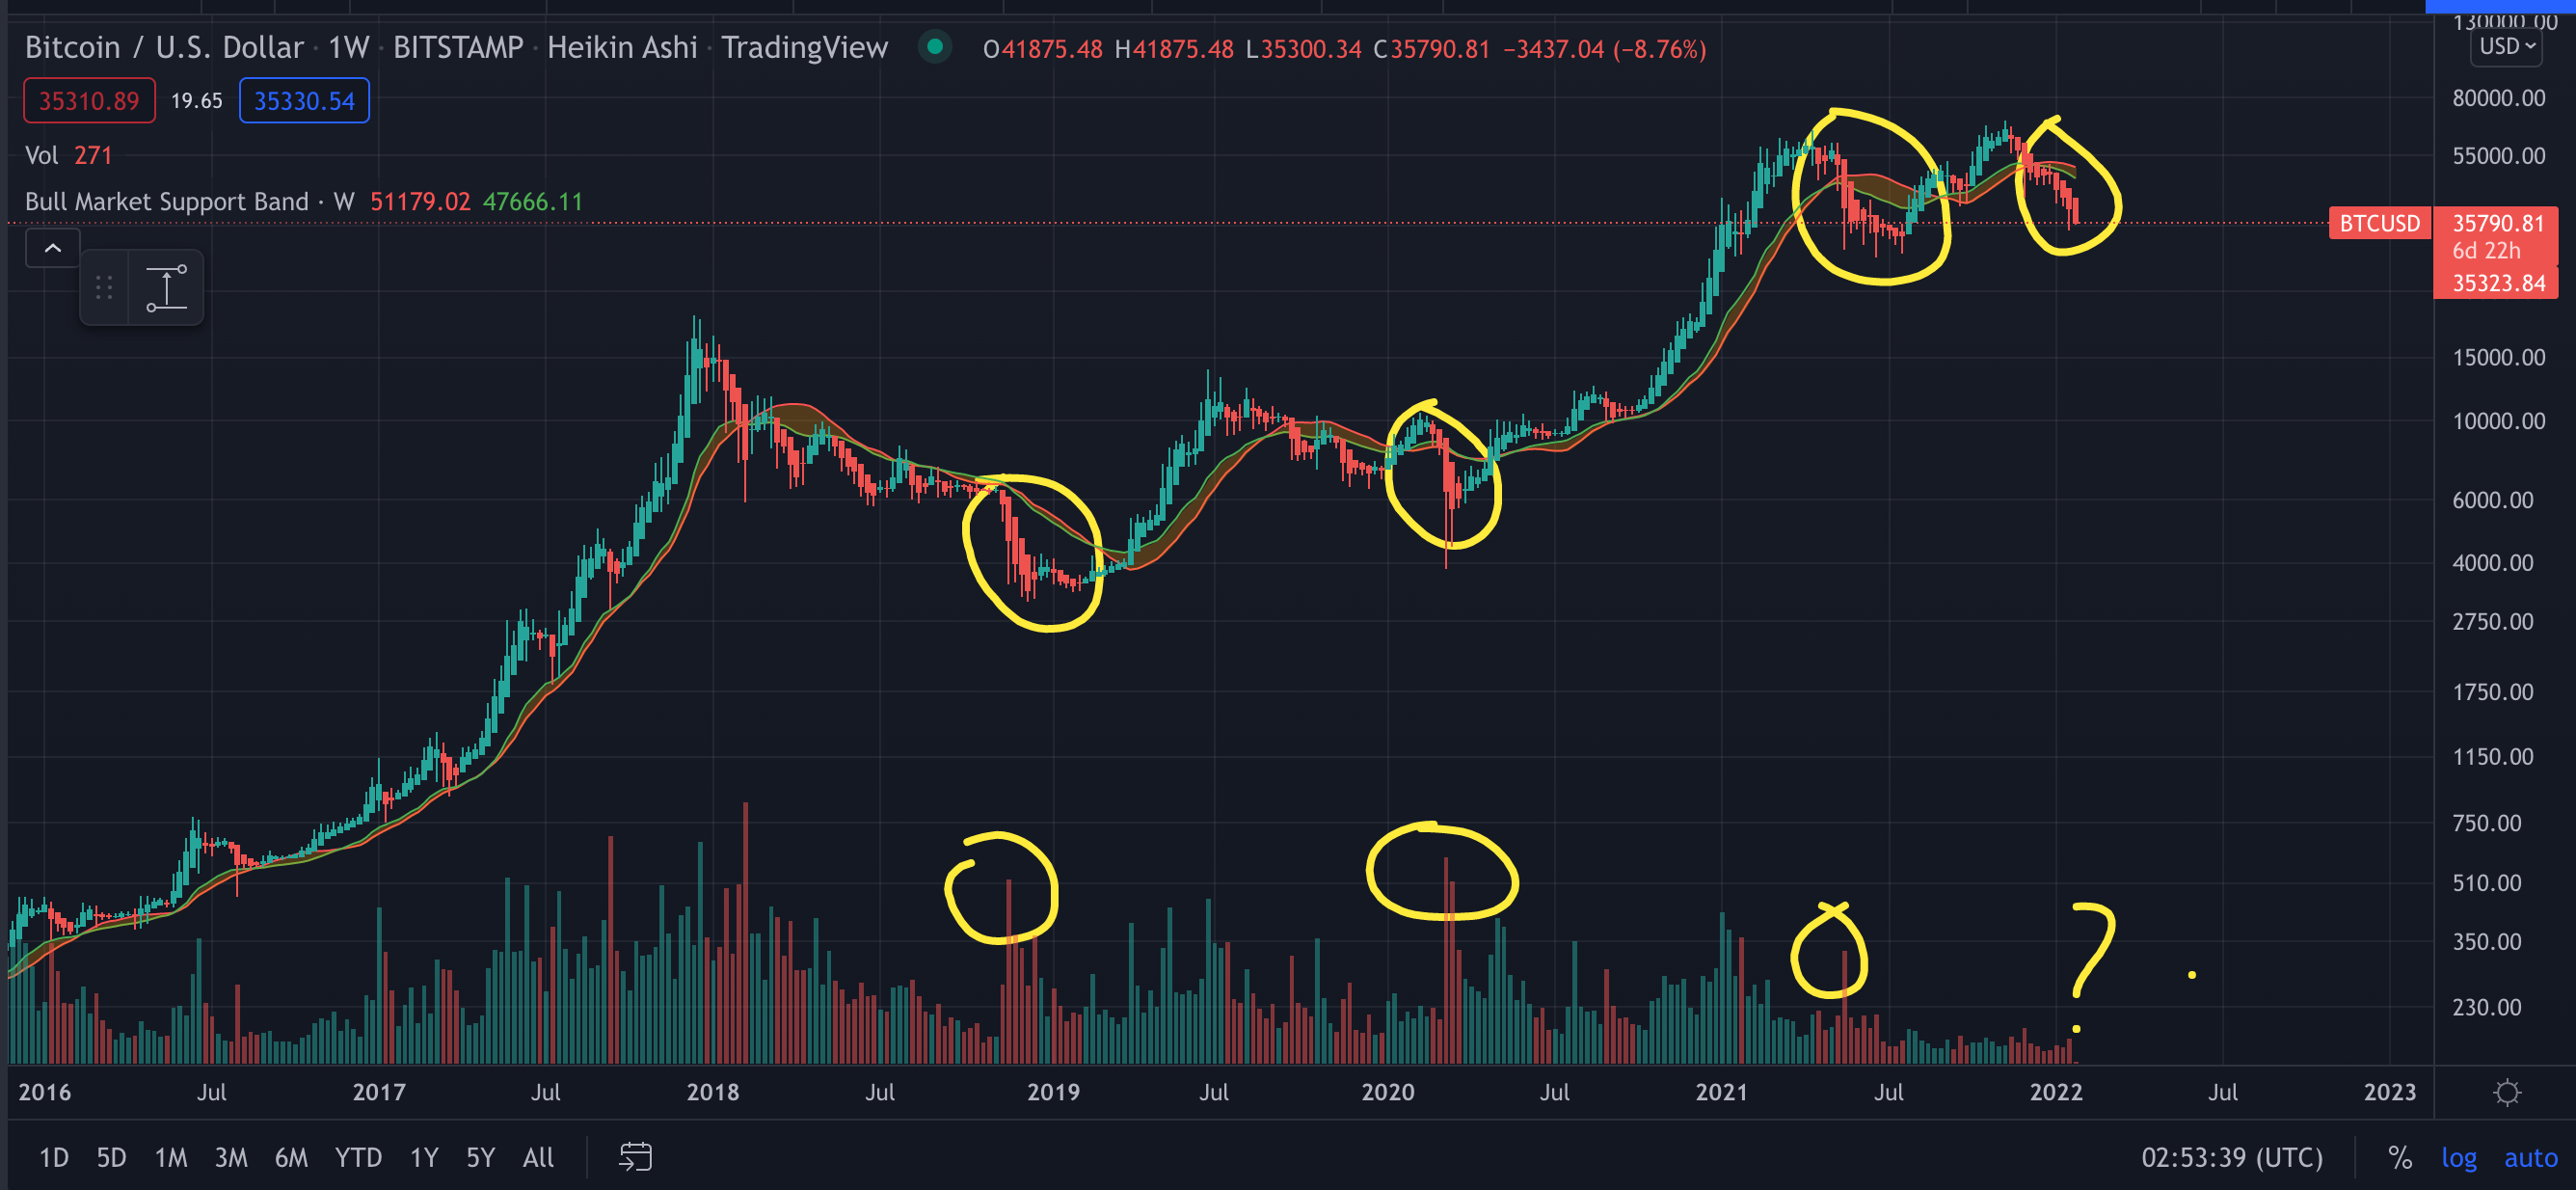
The above chart shows those same 3 prior draw downs that we discussed earlier, with the 40% declines circled in yellow.
What you’ll see, is that in each of those episodes, we often see the chart on the bottom spiking.
The bottom bar charts represents volumes traded.
And what you see is that often times, in each of these episodes, we often get a spike in a week, before things got back to a normal uptrend.
That is called a liquidation cascade.
That means during that week, so many people folded their hands more than usual, indicating that sentiment is at its all time low, and often times is the best time for the market to go back upwards because there simply isn’t any more sellers left.
As you can see, in the current drawdown, we have not seen a liquidation cascade yet. The selling so far seem to be done in very low volume.
We probably have more pain to come before we turn the corner, but I’m ready to hold the line.
Lastly, please consider subscribing below or sending this to your friends if you enjoyed watching me bleed in slow motion.
You can also read prior Sunday notes at web3disruption.substack.com.
See you next week!